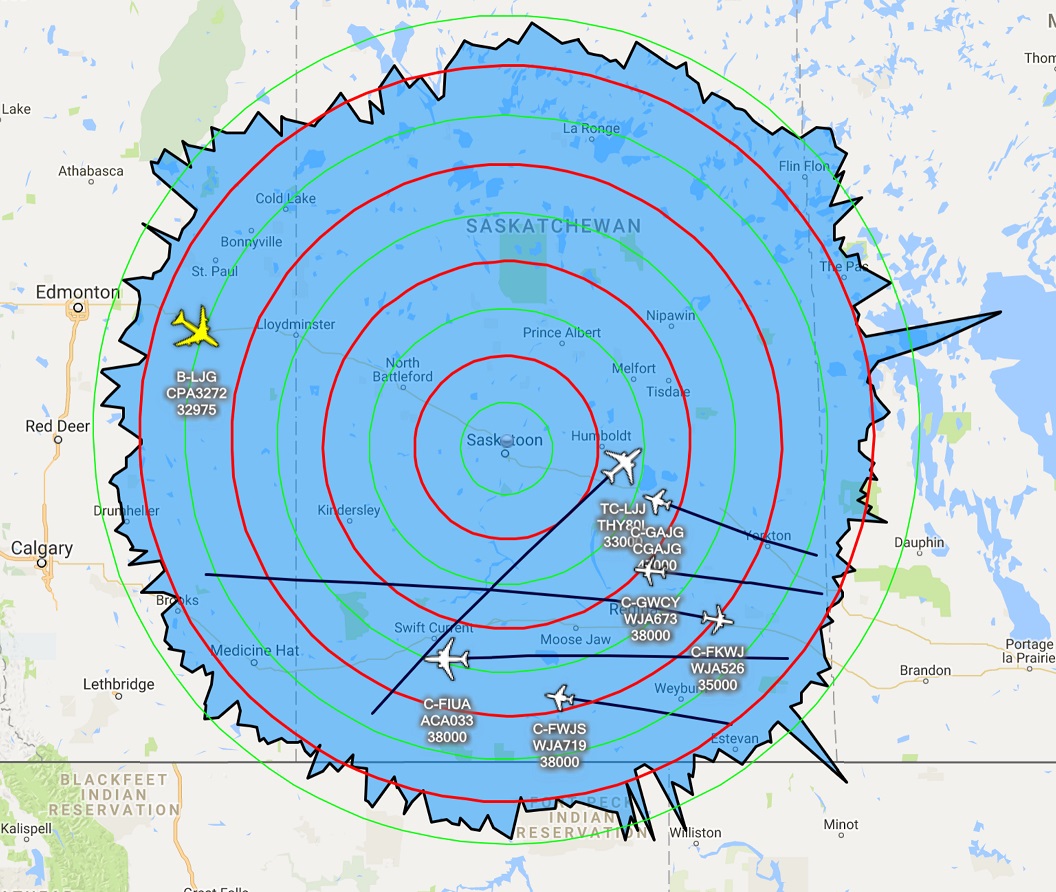
July 2017 Rangeplot
from Planeplotter
 |
| click to enlarge |
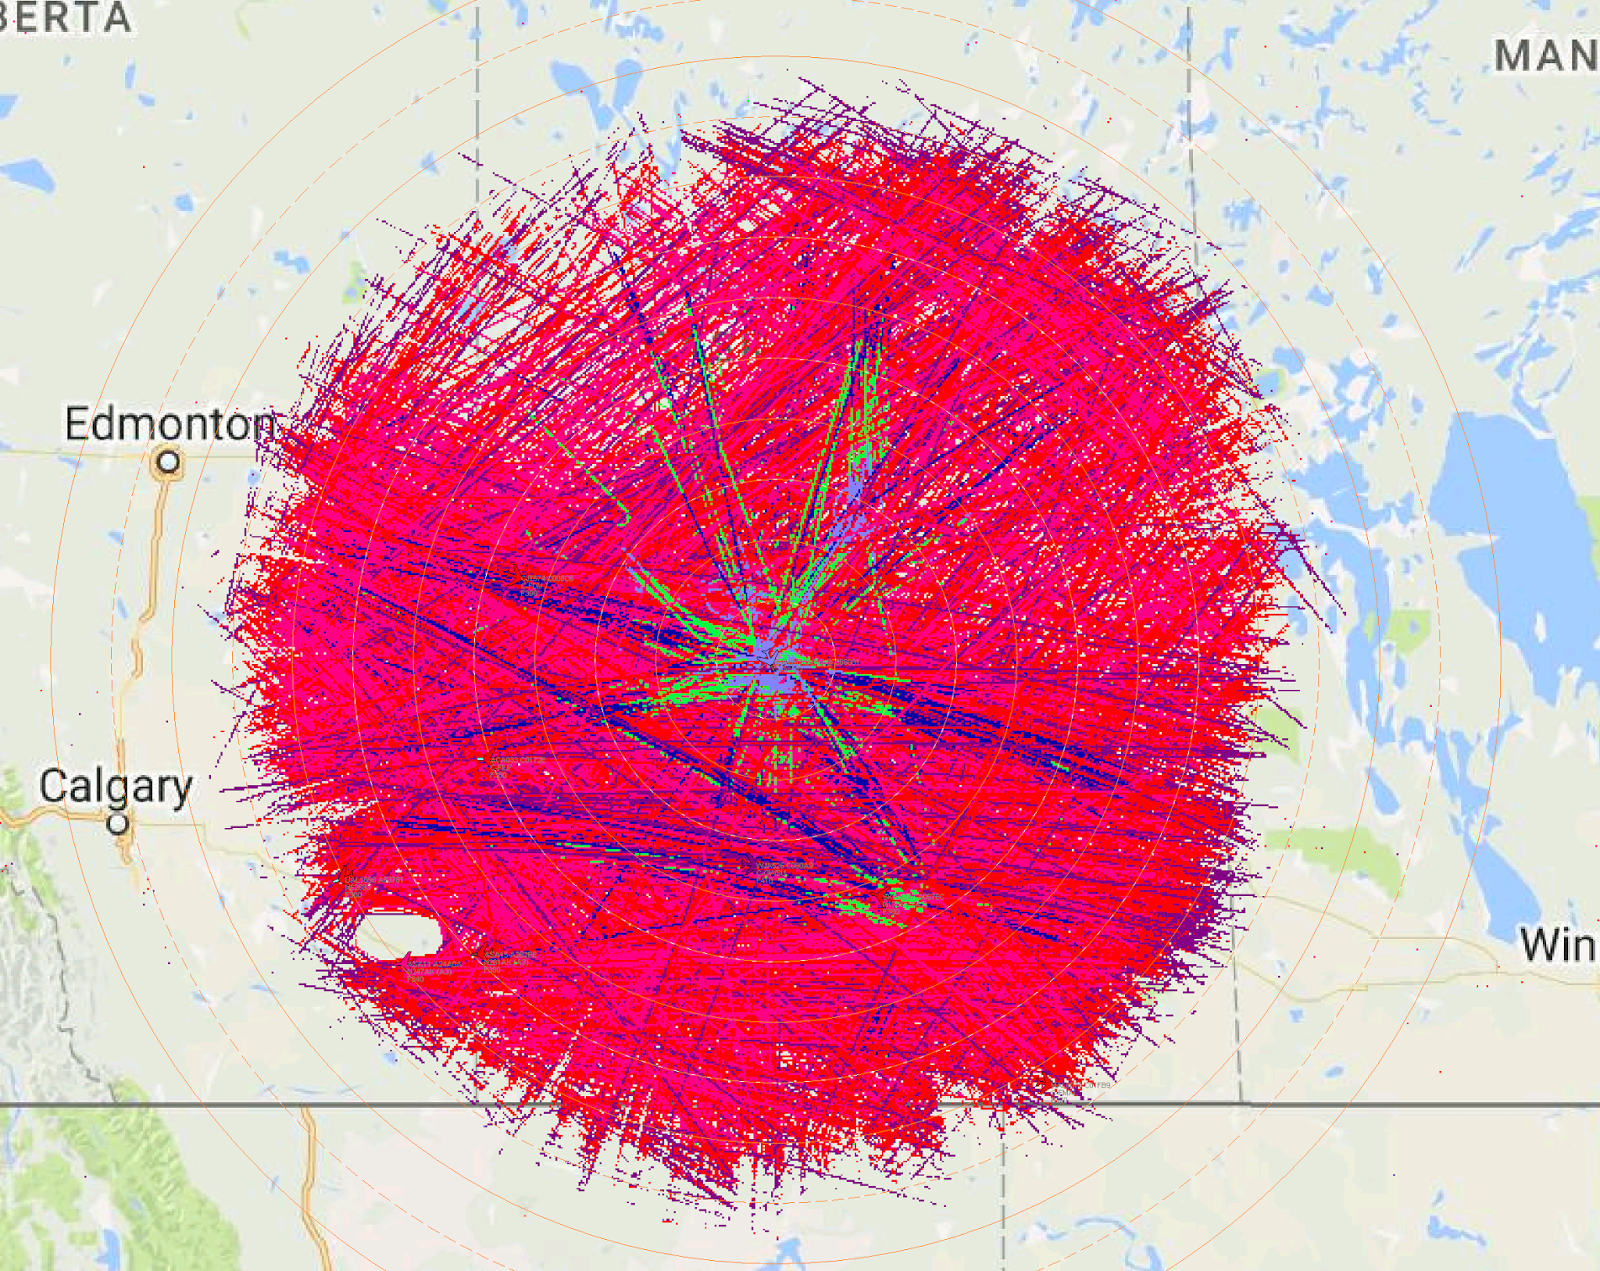
and from Virtual Radar Server
 |
| click to enlarge |
July's results show some significant increases in most directions. The gain settings were the same as June's, but the distances were greater. Some of the increase can be explained by more aircraft at higher altitudes in more directions, however some was purely weather based.
During the month, there were several large storms that passed through Saskatchewan. I've noticed that during storms or in the early morning after a storm, when the air is very humid, my reception range expands. In some cases, whether by reflection, conduction, tropospheric ducting, or some other freak of nature, I've received aircraft at altitudes and distances that should be technically impossible. I'll add a separate post with more details.
During the month, there were several large storms that passed through Saskatchewan. I've noticed that during storms or in the early morning after a storm, when the air is very humid, my reception range expands. In some cases, whether by reflection, conduction, tropospheric ducting, or some other freak of nature, I've received aircraft at altitudes and distances that should be technically impossible. I'll add a separate post with more details.
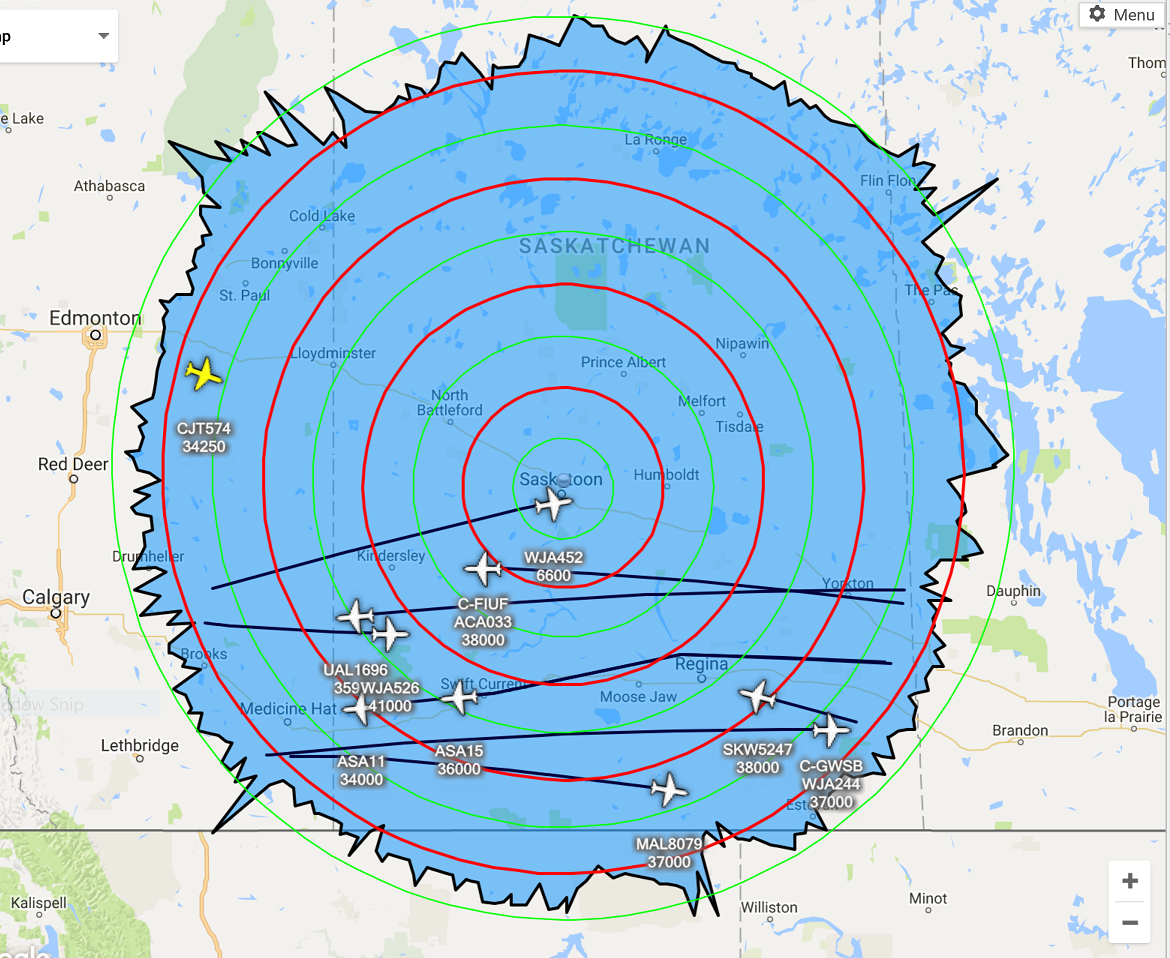
Live view of Saskatchewan skies
Courtesy of opensky-network.org. You can mouse-over each aircraft for additional details, and if you click on the Opensky logo, the link will take you to their website.